Industrial Dashboard For Nuclear Facilities
client: energy company
2023 - 2025
UX - UI design

note: I created this illustration for another project, and it is also suitable as a cover here.
What is presented here correspond to two projects, the second stemming from the first.
What I would like to present below is the UX and UI approach used for the first, and the implementation of a design system in the second, enabling the industrialization oh dashboard production.
Part
First
This project followed a structured methodology with analysis, production, and change management phases. It aimed to improve an Excel-based tool used to manage equipment modifications on nuclear sites before integration into the company database.
The analysis involved 8 structured interviews across two teams, followed by transcription, categorization, and synthesis. This user research led to the creation of three personae with emotional maps to guide the design process.


5 user tests were conducted on the initial wireframes to assess usability and accessibility, followed by 9 additional tests on the final prototype. Users feedback were carefully analyzed and synthesized, highlighting significant time savings and strong appreciation for the new functionalities.
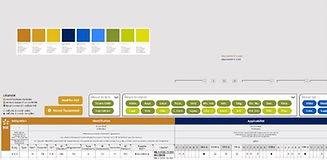
Continuous discussions with the development team ensured technical feasibility throughout the process. After receiving the client's graphic guidelines, the prototype was refined to align with the brand identity, using a color palette verified through color blindness testing.


The change management phase focused on helping users adopt the new tool through multiple support materials. Based on interview feedback requesting clear guidance, a comprehensive learning ecosystem was developed, including motion design, e-learning modules, webinars, newsletters,...
I designed the graphic environment, which served as the foundation for all media, using a sailing journey from Marseille to Tours as a storytelling framework. I also produced the tutorial sheets accompanying the new tool to ensure a smooth user onboarding experience.
Second
Part

client screens
I initiated the creation of a design system to harmonize all dashboards and strengthen their connection to brand's visual identity. The goal was to provide teams with a clear framework and reusable components to quickly build their dashboards in Power BI, while ensuring visual and functional consistency across tools.
This system was designed to be flexible, allowing for adaptation to other platforms, and to create a unified, recognizable experience for all users.


I hope you enjoyed this project. Feel free to continue exploring.
Oh, by the way, I share my passion for drawing and manga on my Instagram @life.o.c.
Come check it out if you are interested.
